 ServerWatch · app for the Mac
Your server runs around the clock.
ServerWatch keeps an eye on it.
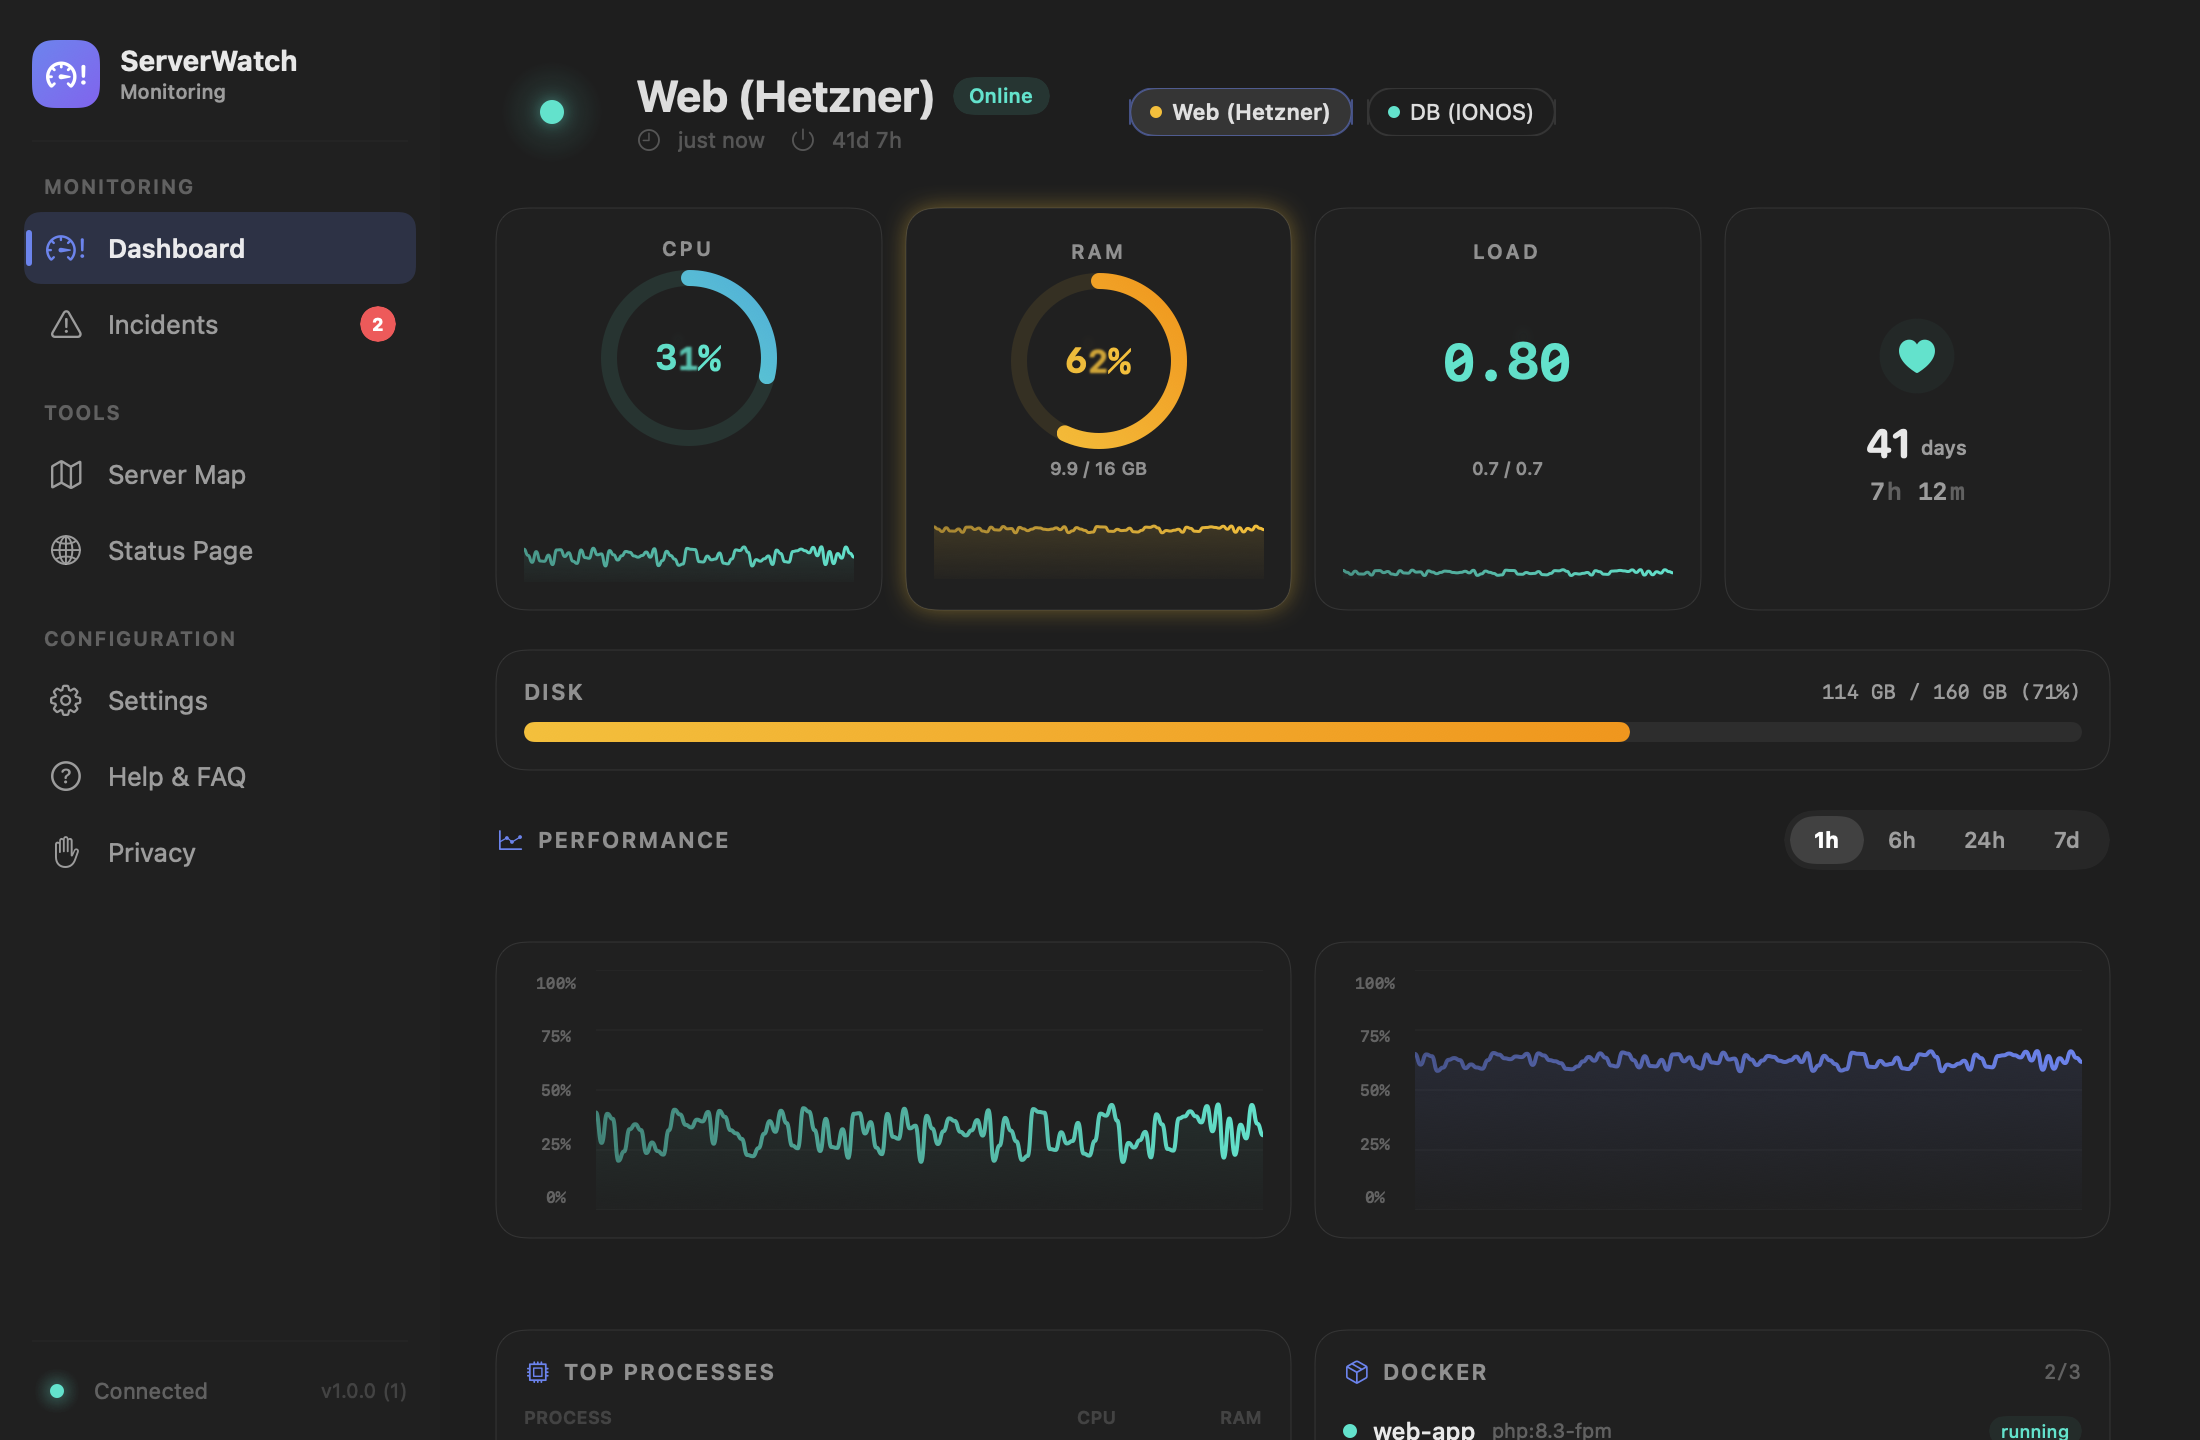
ServerWatch shows CPU, RAM, load and disk space for your server right in the menu bar, with history, alerts and its own status page. One PHP script on your server is enough: no agent daemon, no cloud account.
Version 1.0.0 · 05.09.2026
ServerWatch in real life
The dashboard, the menu bar and the tools behind it, just as they look on your Mac.
Everything you want to know about your servers
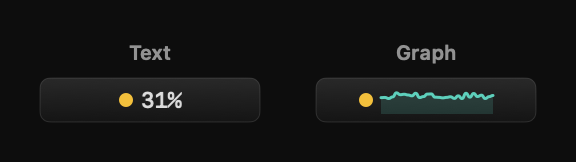
Live graph in the menu bar
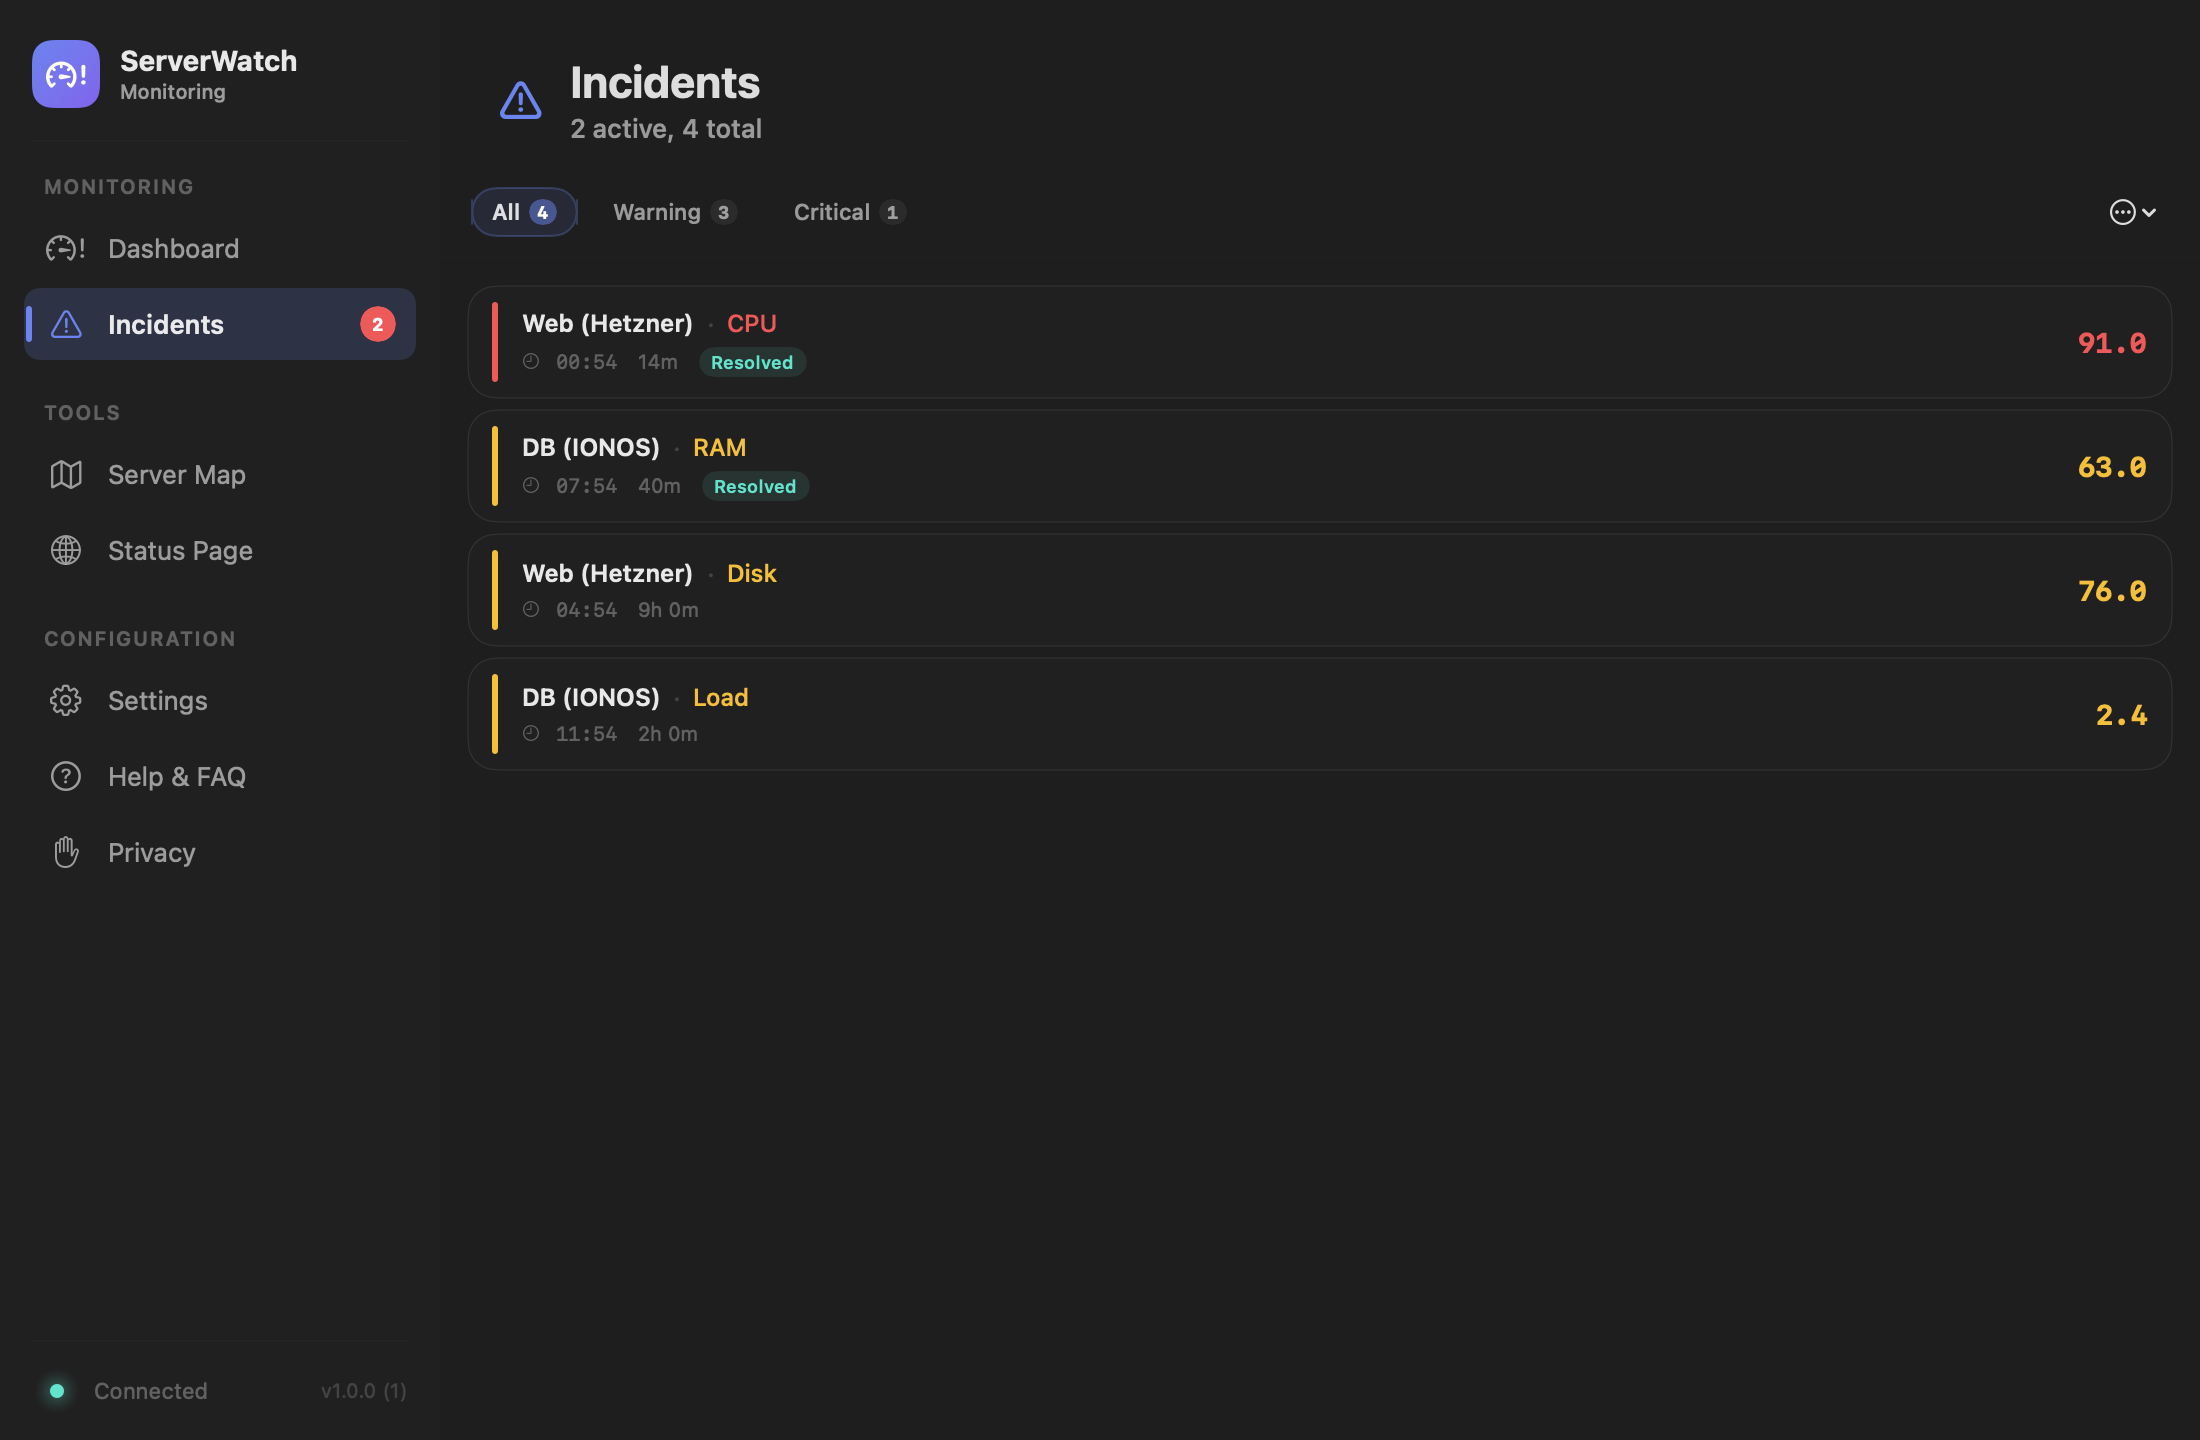
A single dot tells you the state at a glance: green is normal, yellow is a warning, red is critical. Add a mini graph of the last 30 readings if you want one.
Interactive charts
Zoom through one hour, six hours, a day or a week of history, with the exact value and time under your cursor.
Docker monitoring
Every container with its name, status, CPU and RAM usage, network and block I/O, and port mappings, without giving the web server any Docker rights.
Trend alerts
ServerWatch projects your history forward and warns you before a value actually turns critical, not after.
Webhooks
Slack, Discord, Telegram, PagerDuty or a URL of your own: notified automatically whenever a new incident occurs.
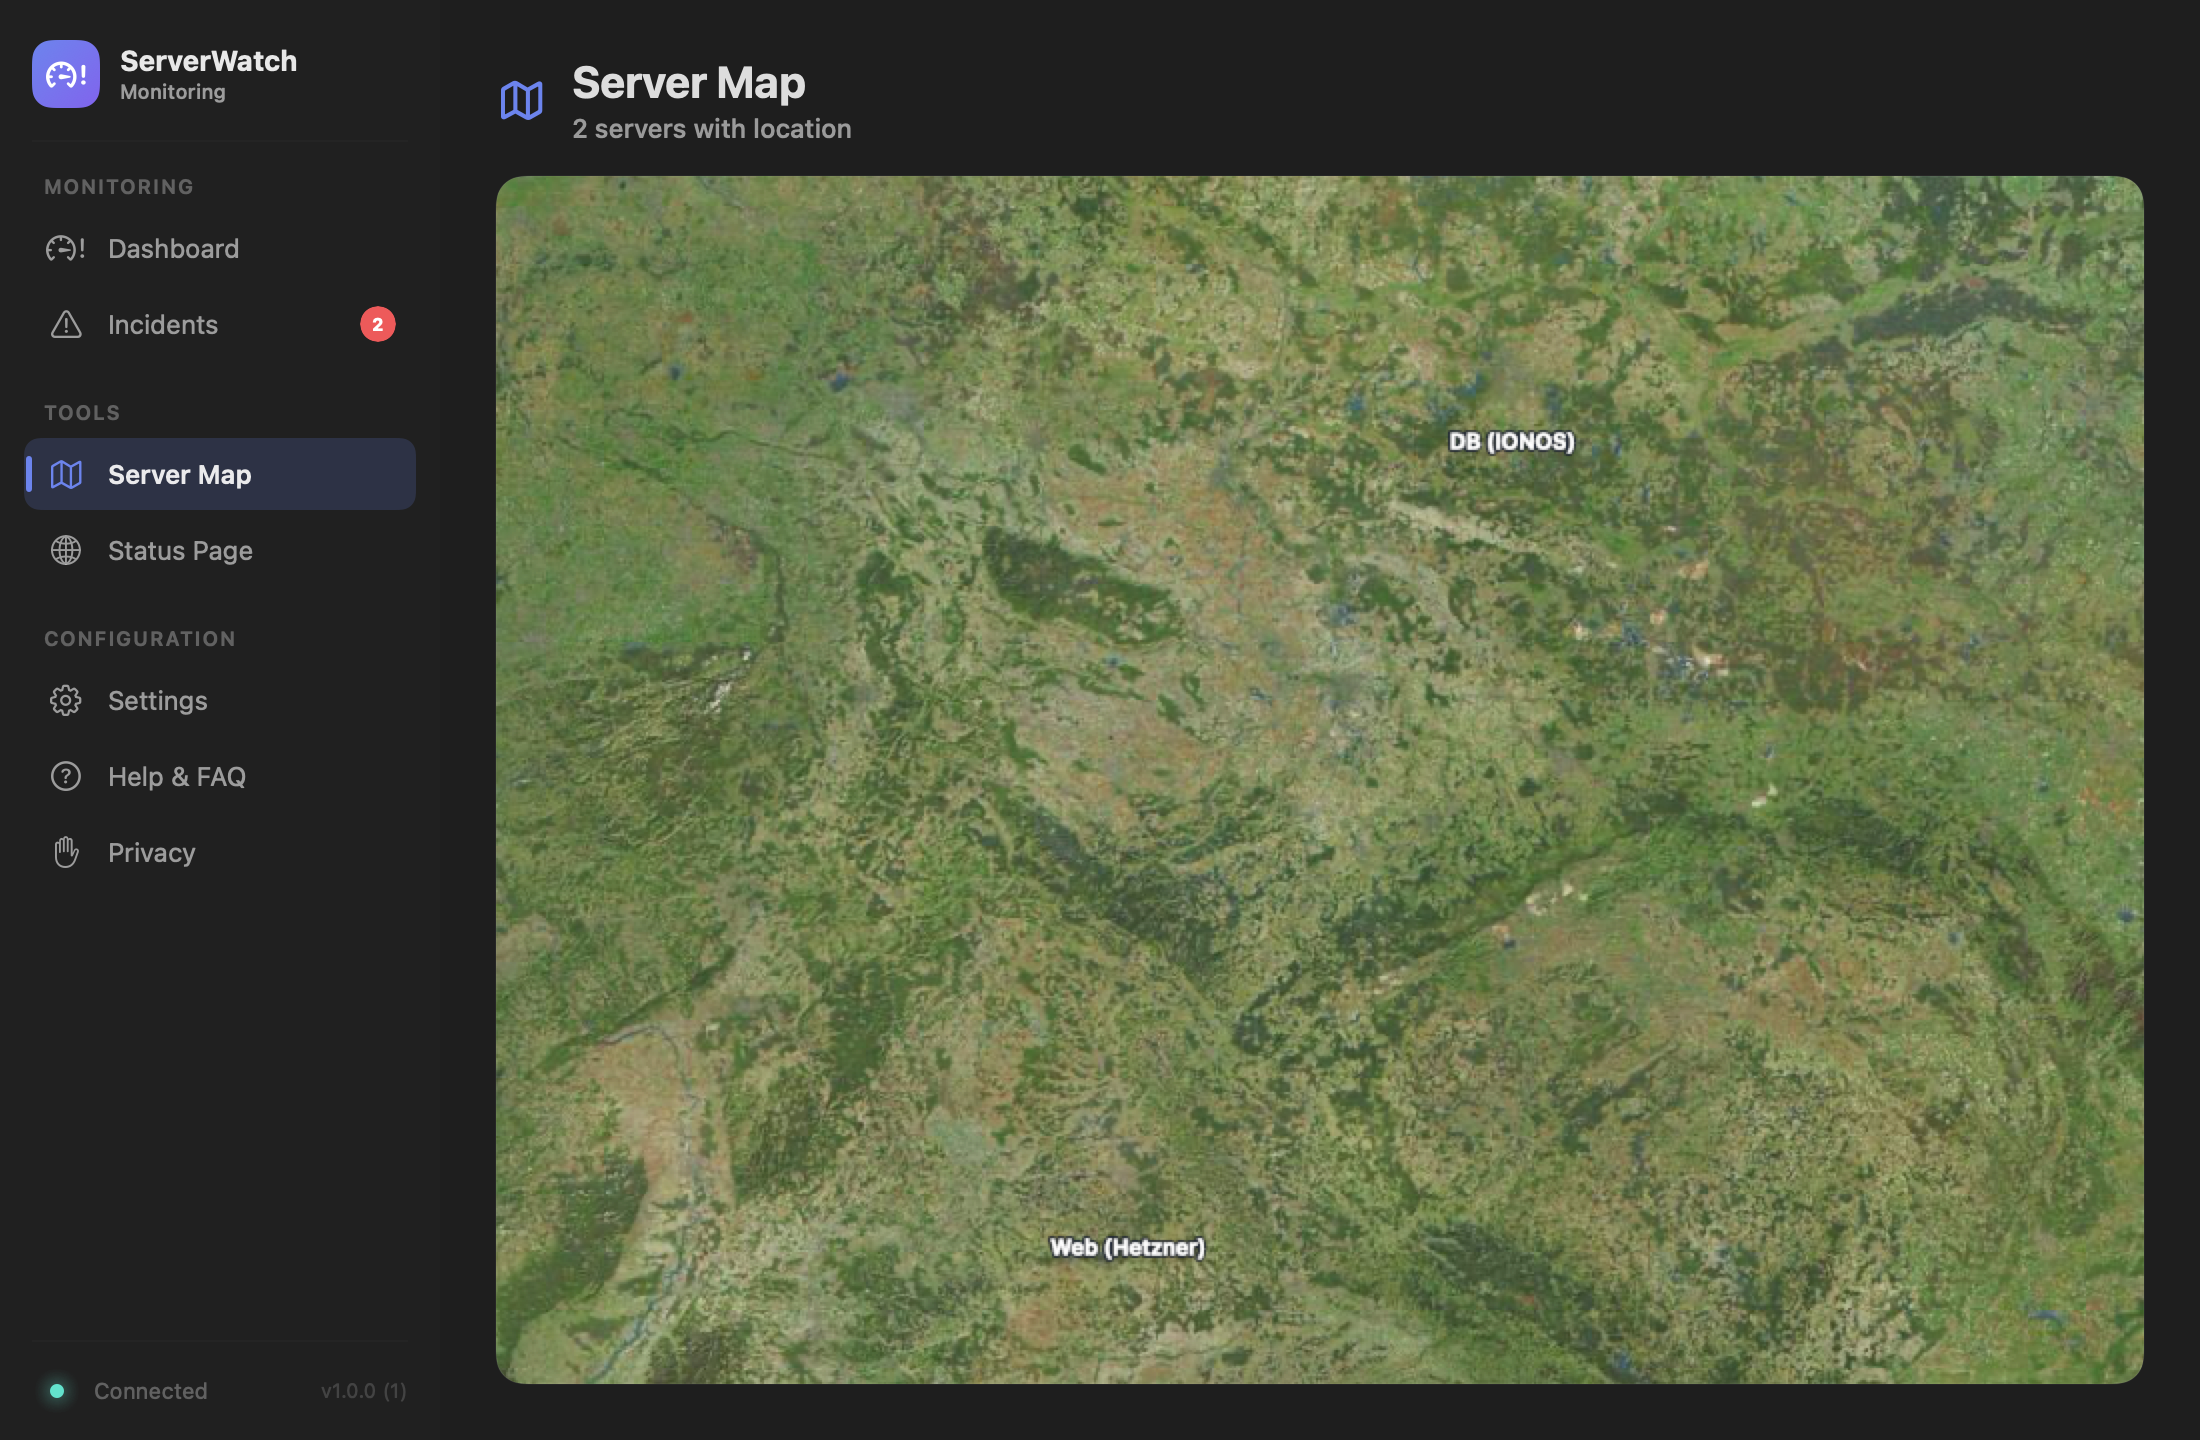
Server map
Every server on a world map, with its own location by address, coordinates or one of 13 presets.
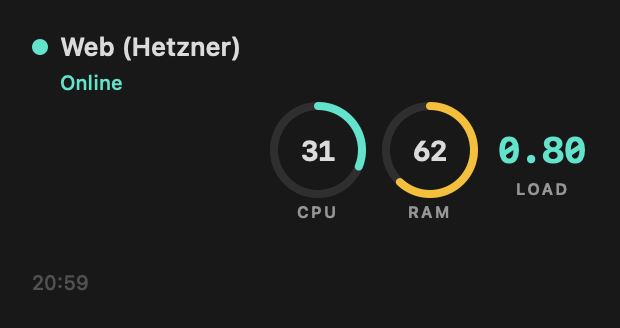
Widgets and Siri
A widget on your desktop, a Siri command for the status: "How is my server doing?"
Set up in three steps
Upload the agent
Copy the PHP script from the app and upload it to any web directory on your server, such as httpdocs/. PHP 7.4 or newer is enough.
Connect
Enter the server URL and an API key in ServerWatch. The setup wizard tests the connection before monitoring starts.
Done
ServerWatch polls your server at the interval you set and shows CPU, RAM, load and uptime right in the menu bar.
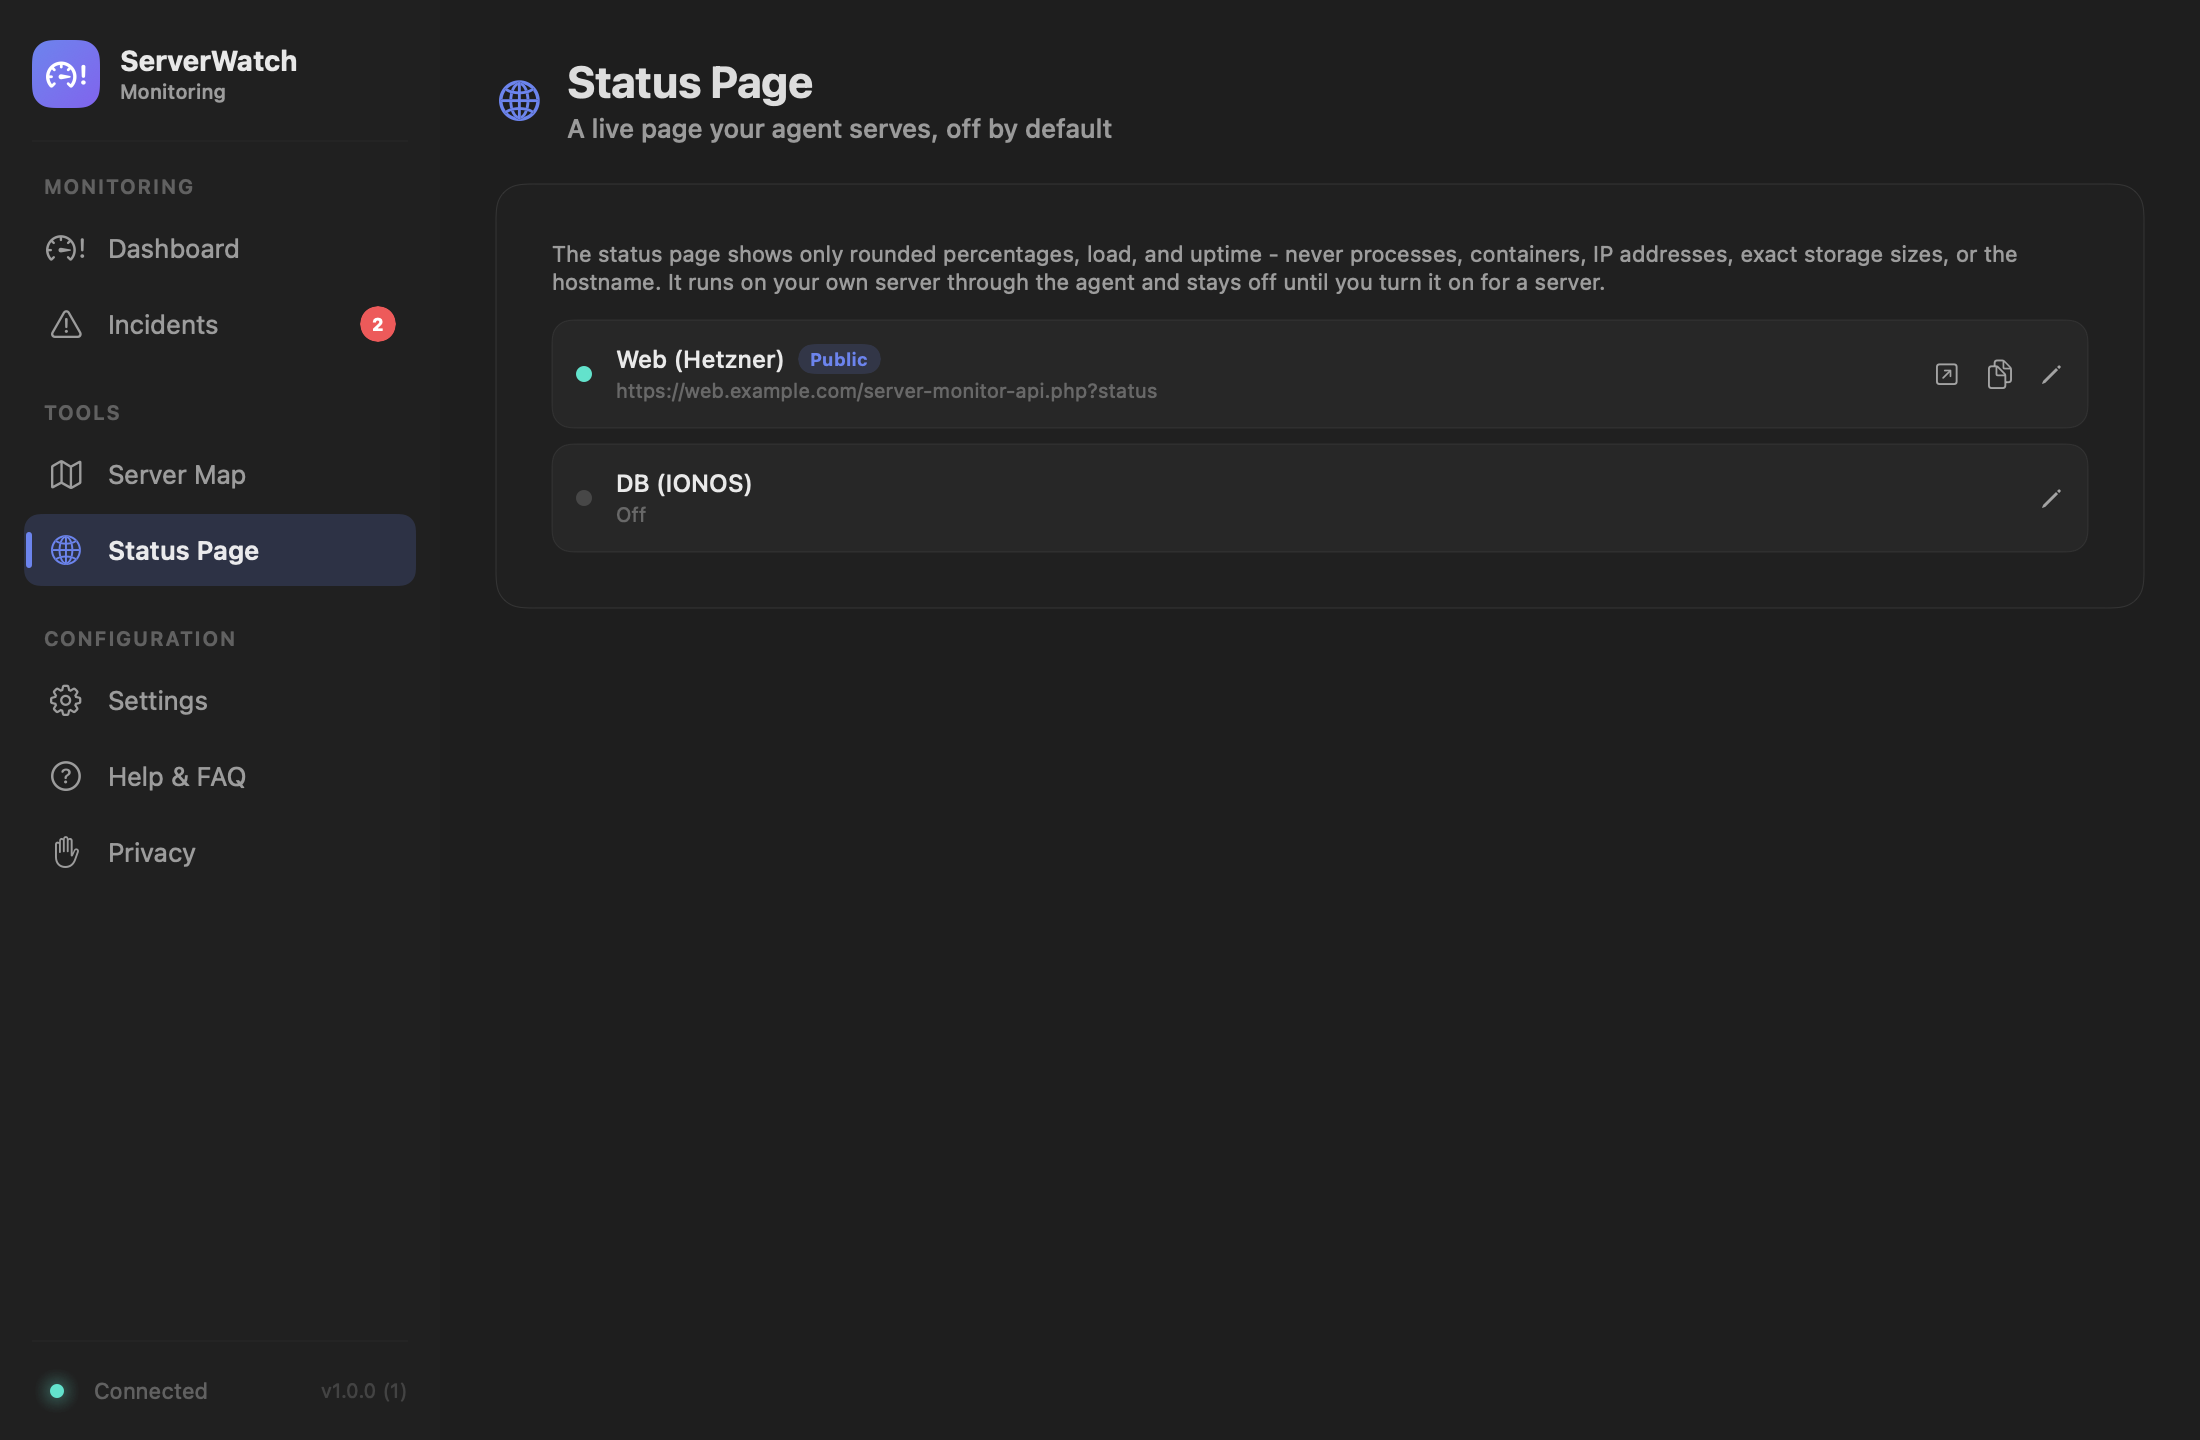
A public status page, live from your own server
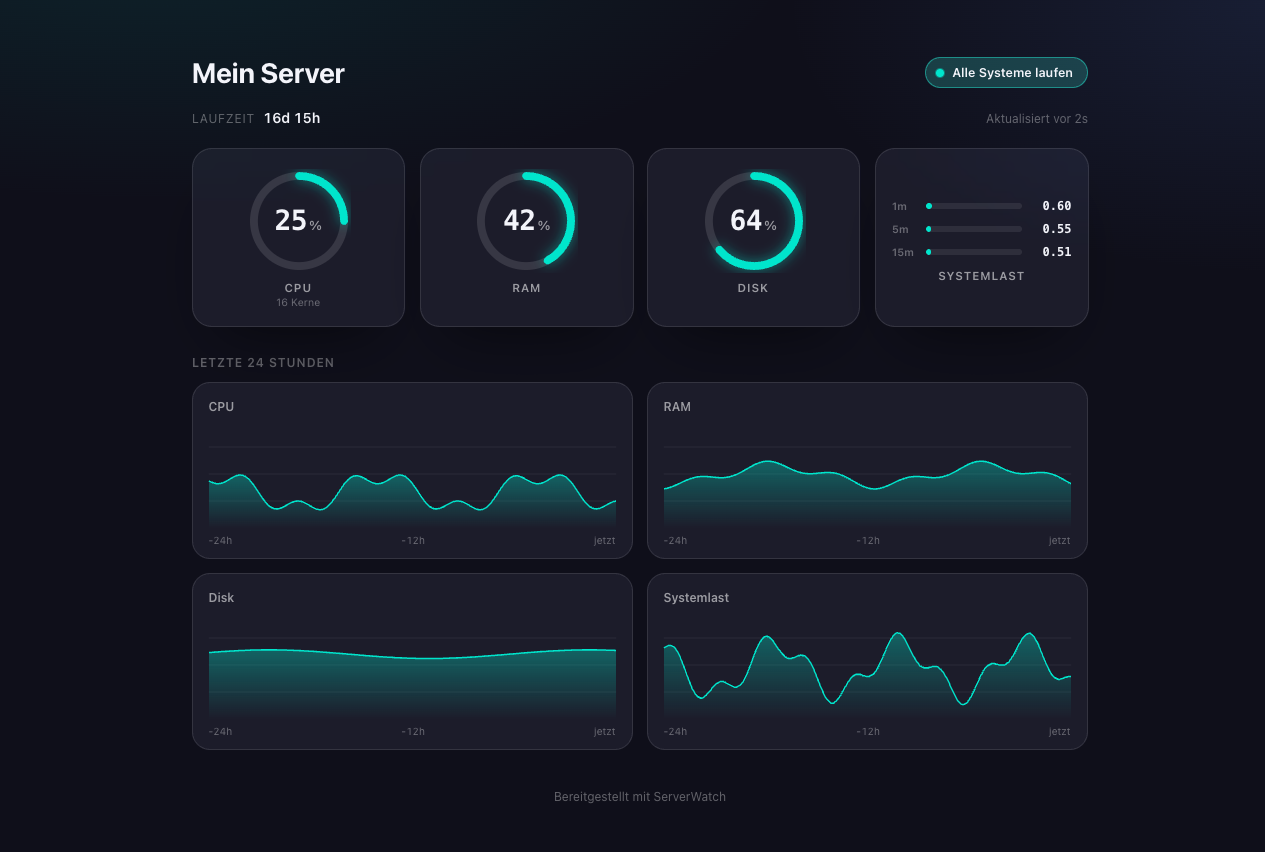
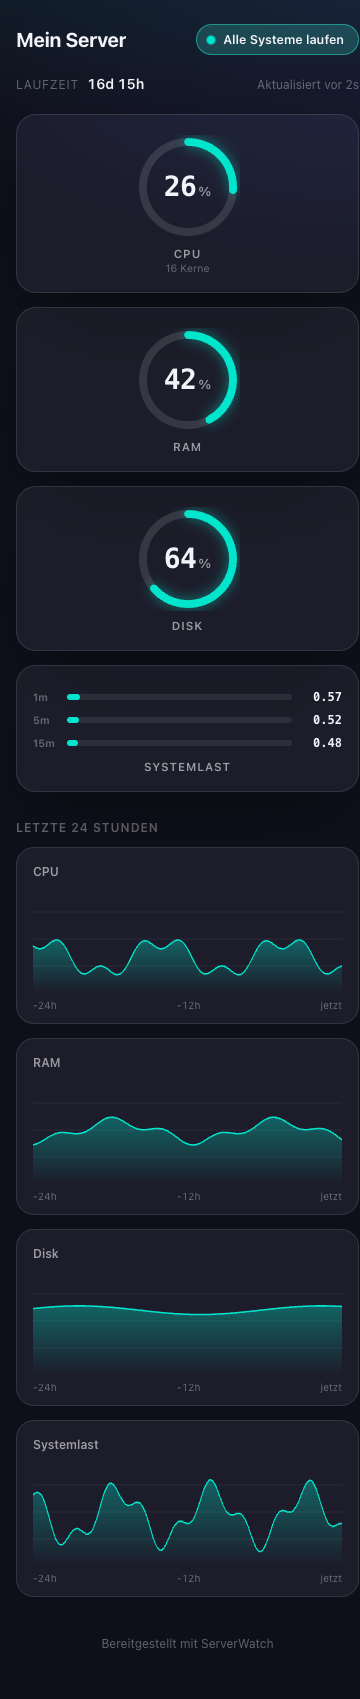
No export, no snapshot: your agent serves the page itself, with rings for CPU, RAM and disk, a 24-hour history and an overall status. It refreshes itself every 30 seconds.
- Off by default: you turn it on per server.
- Never processes, containers, IP addresses or the hostname, only rounded percentages, load and uptime.
- Open to anyone with the link, or protected with a link token.
Try for free, then buy once
| Free | Pro | |
|---|---|---|
| Servers | 1 | 10 |
| Poll interval | from 30 seconds | from 5 seconds |
| Interactive charts | ||
| Top processes | ||
| Docker monitoring | ||
| Trend alerts | ||
| Price | free | 29,00 € |
Your servers stay your business
- ServerWatch only connects to the servers you add yourself, and to no one else, unless you set up webhooks or the update check.
- No telemetry, no account. Server addresses live in macOS settings, API keys in the Keychain.
- The status page runs on your own server and never shows processes, containers or IP addresses.
Buy once, use everywhere
- The license key arrives by email, right after purchase.
- ServerWatch checks the key offline: no activation over the internet needed.
- The key works on all your own Macs, with no activation limit.
- Updates are included in the purchase price and come straight from PixAgentur.
What you need
- macOS 14 or newer
- A Linux server with PHP 7.4 or newer and a web server that can serve a single PHP file
Common questions about ServerWatch
What is ServerWatch?
A macOS menu bar app that watches your servers in real time: CPU, RAM, load and disk right in the menu bar, plus a dashboard with history and incidents. A small PHP script on your server supplies the data.
How long can I try ServerWatch, and what happens after that?
14 days for free, with every Pro feature turned on, no account needed. After that, the Free limits apply without a license: 1 server, polling from 30 seconds, no charts, top processes, Docker or trend alerts. Nothing gets deleted.
What is the difference between Free and Pro?
Free shows 1 server with polling from 30 seconds and the basic values CPU, RAM, load and disk. Pro adds up to 10 servers, polling from 5 seconds, charts, top processes, Docker monitoring and trend alerts, bought once, no subscription.
How do I activate my license?
Enter the key from your order email under Settings, "License & Updates," or open the activation link from the same email, which fills in the key for you. The check runs offline, with no server request.
Can I use my license on more than one Mac?
Yes. One license covers all your own Macs, with no activation limit and no account. Just enter the same key on each Mac.
How do I set up the agent on my server?
Generate an API key in ServerWatch, copy the PHP script and upload it to any web directory, such as httpdocs/. It requires PHP 7.4 or newer with shell_exec allowed. Then test the connection right in the app.
How secure is the agent on my server?
Every request needs the API key in the X-API-Key header; without it, the script answers with 401. The script also limits itself to one request per second per IP address.
What is the status page?
A public, live-updating page that your agent serves itself. It shows CPU, RAM, disk and load as rings and bars, plus uptime and a 24-hour history: no export, no snapshot.
What does the status page never show?
Never processes, Docker containers, IP addresses or your server's hostname, and never absolute storage figures, only rounded percentages, load and uptime.
How does Docker monitoring work?
If the script detects Docker on your server, ServerWatch shows every container with its name, status, CPU and RAM usage, network and block I/O, and port mappings. The web server user itself needs no Docker rights for this.
Keep an eye on your first server
14 days for free, every Pro feature included. If you like ServerWatch, buy the license once, for all your Macs.